Telling Stories, Connecting Communities

Category: Student Blog

Strategic Planning with the Textile Heritage Trail

Author: Greg Bell

 When you join a project that has been going on as long as the Textile Heritage Trail, it can feel a little overwhelming. So many people’s energy and passion have gone into making this site what it is today, and at the beginning, I did not know exactly how to start getting involved myself. But when I was tasked with working with stakeholders this semester as part of our ongoing strategic planning, I knew this would be a great opportunity for me to really see how much this project means to people from all of our featured communities. As a result of the conversations I had this semester, I now feel like I’m right in the middle of the work being done. Our stakeholders’ passion is infectious, and their excitement about sharing what they are planning as well as ideas for how we at the Textile Heritage Trail can help them achieve their goals helped me understand how much the work we do here matters. 

Image of E-Z Mill Workers
E-Z Mill workers. Photo courtesy: Bartow History Museum

Working with stakeholders is an important part of any kind of public history project. Their input and expectations can be one of the most important elements that go into making a project succeed or fail. When I was first told that I would be responsible for speaking with our stakeholders this semester to find out what exactly they would like to see from the Textile Heritage trail going forward, I knew this was a major part of our strategic planning process. We had already been soliciting feedback from users on our website and had begun to make changes based on what we had heard, but this was going to be a completely different experience. I was admittedly nervous when I made my first phone call. What if I messed up a question, or misrepresented something one of my contacts asked? What if they didn’t want to talk to me?

As soon as I introduced myself, I realized that those were unwarranted fears. Our stakeholders were so excited to talk with me about what they were doing in their communities to interpret their textile histories and were eager to hear what ideas we had to support them. Everyone was kind and helpful, and almost immediately I began looking forward to making my calls. Altogether, I spoke with over 90 people who are involved in textile history, from librarians and museum professionals to city managers to tourism directors and chamber of commerce executives. They took place over the phone, over Zoom, and in a few cases through email. There was one of these conversations that were especially meaningful for me because I got to speak with the stakeholders in person. 

A view of the Atco/Goodyear mill site and water tower. Photograph by Greg Bell

    When I called Trey Gaines, the director of the Bartow History Museum, to set up a time to talk, I knew he would have a lot of meaningful input. Trey and I have known each other for a long time since I first interned at the museum while getting my bachelor’s degree. When he asked if I wanted to come and talk in person, I decided to make a day out of the trip. I arrived in Cartersville at 9:00 and met with Trey Gaines and Sandy Moore. We spoke at length about how the museum interprets the textile history of Bartow County, and I got wonderful feedback from Trey and Sandy about what we at the Trail could do to better support them in the future. As we were wrapping up, I asked what sites I should try to visit before I left Cartersville, and Trey and Sandy gave me directions to two of the old mill sites. 

Aerial view of Goodyear and Mill Village
Goodyear and mill village aerial view. Photo courtesy: Bartow History Museum

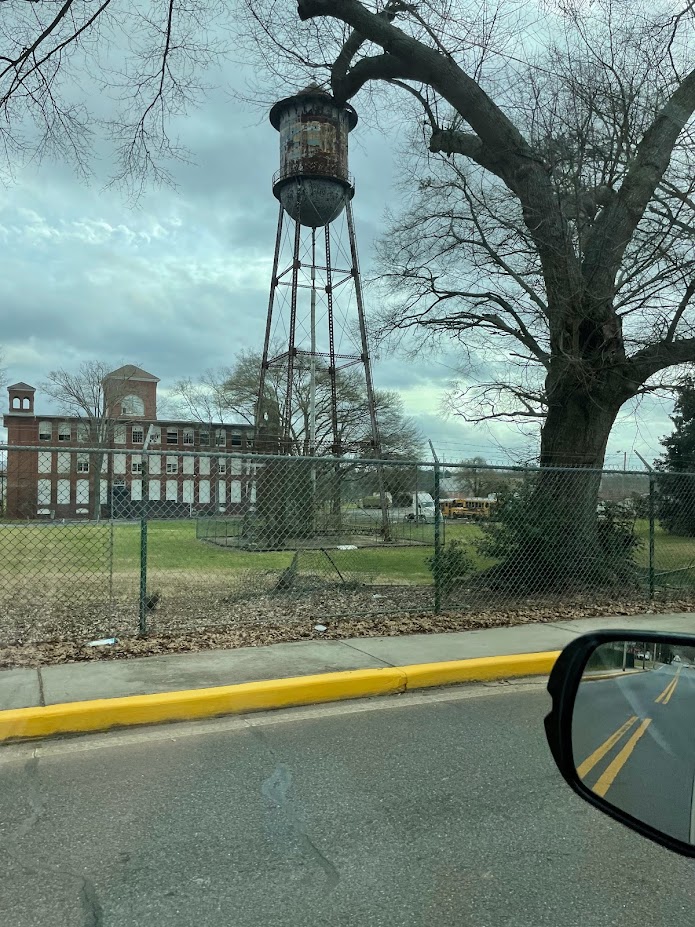
 I left the Bartow History Museum and headed towards the first mill site Trey had told me about, ATCO & Goodyear. I arrived and looked around for a while, and then drove through the nearby mill village Sandy had told me about. The mill site itself is mostly gone, and the village’s homes are now just private residences, but being there in person I was able to picture what this site must’ve looked like while still operational. I then drove over the other mill site Trey had mentioned, the former E-Z Mill. Today, it is in operation as the Spring City Technology park, so I was not able to get an up-close look, but from the perimeter I could see the original building. Finally, before leaving town, I pulled up our Cartersville community page from the Textile Heritage Trail site, and used our StoryMap to navigate to other places of interest. It felt like I had stepped out of the role of textile history interpreter, and was instead just an enthusiast using our site for its intended purpose. From this point of view, I thought about the ideas I had discussed with Trey and Sandy, and I couldn’t help but get excited all over again. 

As a result of the conversations like I had with Trey and Sandy, the Textile Heritage Team is planning on starting some exciting new work in the coming semesters. We’ve already made changes to our website, and new community pages are on their way soon. I’m grateful to be a part of the process and have enjoyed hearing the passion and joy other people have in interpreting these stories, because in the process it became my joy, too. I hope that as we continue in our strategic planning and determine what the Textile Heritage Trail will look like going forward, you are taken in by that passion too. I, for one, can’t wait to see what we do next. 

Visualizing Data

Author: Tennesse Mena

In the Spring of 2022, I commenced my work in the West Georgia Textile Heritage Trail project with the guidance of Dr. Andy Walter, Dr. Ann McCleary and Keri Adams. I began with making visual representations of the number of mills throughout the years of 1870 to 1976 of a few of the communities within the region of West Georgia and eventually made graphs of each community represented. These visual representations were in the form of bar graphs and culminated into a 3-D model graph which portrayed the number of mills throughout the years and compared them to all other communities within the research region.

It is amazing to see a visual rendition of the dataset as it portrays the history of the textile mills in West Georgia. It is interesting to see the decline of textile mills that some communities have experienced and the increase that others have gone through. What would be fascinating to see is the Gross Domestic Product (GDP) of the cities compared to the number of textile mills throughout the years and if there is a correlation between GDP and number of textile mills. Another worthwhile project to undertake would be the representation of women owned textile mills in West Georgia, if there is any, and their stories. 

As the semester progressed, I started mapping out the West Georgia region using Quantum GIS (QGIS). QGIS is a free to use and open source mapping software that offers a wide range of data editing and mapping features. This allowed me to learn more about the program and I delved into refreshing my memory of mapping and QGIS as well as learning new things about the program and how to produce an end result that is both visually pleasing as well as easy to read and understand. When making a map, or any other visual representation of data, one must always keep in mind the viewing audience and cater to them, making it intriguing, informative, and readable. Throughout my time spent graphing, mapping and collaborating with others, I was able to learn so many valuable skills that I will take with me for my future professional endeavors.

All of my work throughout the semester culminated into the Scholars’ Day end results seen below. Scholars’ Day is sponsored by the Honors College and the Office of Undergraduate Research. It is a day in which undergraduate students present their research projects in the form of an oral presentation, poster presentation (which is what I did), visual arts presentation, or a performance presentation. It tells the story of the economic flow of the West Georgia textile industry. As we can see, nonlocal investment steadily increased throughout the years, first seen with the nonlocal ownership in Massachusetts. This then spread to regions on the east coast but there were even nonlocal investments in both California and Arizona in later years. It is amazing to see the changes throughout the years and how it has shaped these communities into what they are today. 

Scholars’ Day was a great experience as I was able to put my presentation skills on display. Of course I was nervous at first but after presenting my project over and over again, I was able to lose my nervousness and perfect my presentation along the way. This was great exposure for my future endeavors and I truly did learn from my experience at Scholars’ day. There were some great suggestions from the audience at Scholars’ day, one of which resonated with me. Someone in the nursing profession suggested seeing the correlation of cancer rates within these communities compared to others that are not around textile mills. This could be a possible project undertaken in the coming semester or in the future.

Slideshow of Maps:

These graphs were very enlightening and show how visual representation can contribute so much to understanding a topic. They are also very easy to read and understand so that it reaches a wider range of audience. While making these graphs, I noticed several trends, one of which is an increase in mills in some of the cities such as Dalton, GA and Calhoun, GA. It can also be seen that some communities have remained consistent with the number of mills throughout the years as well as a decrease in the number of mills in other communities. 

It’s amazing to see all this information side by side, year by year and comparing how the mills have increased, decreased, or remained constant in communities over time. With the help of some more research, these graphs can be further developed to provide a more detailed depiction of the fluctuation of the number of mills within these communities throughout West Georgia and how it has affected them. Collaboration with these communities is an essential part of accurately portraying the stories told by these graphs. The graphs are only a small portion of the full story.

Slideshow of Graphs:

Mapping for the Textile Heritage Trail


Warning: Undefined array key "file" in /home/westgate/public_html/wp-includes/media.php on line 1734

Author: Jamie Bynum

I began working for the Center for Public History at the University of West Georgia in January 2020. I have worked exclusively on the West Georgia Textile Heritage Trail project performing a variety of tasks. My main task has been to create maps for the Trail to bring history to the public in a visual manner. To accomplish this, I have used two programs: Story Maps and ArcGIS. These maps also serve as my thesis project for my Master of Arts in History degree.

This is a view of creating one of my many maps in ArcGIS. For this specific map, I have added additional data to create an animated timelapse.

If you have looked through our community pages, you might notice almost all of them have an interactive map showing textile-related locations within that respective community; these were all created using Story Maps. As the name suggests, Story Maps allow us to tell a story. For this project, that would be each community’s textile history. While the West Georgia Textile Heritage Trail is a digital history project, it is also a tourism initiative. The use of Story Maps allows the public to not only learn historical information about a community’s textile industry but navigate to these places to see what they look like today.

The maps I have created with the ArcGIS program are more for historical research rather than tourism. These maps, unlike the Story Maps, are not interactive and remain stationary. My thesis topic centers around the importance of waterways and railroads to textile mills in the 1800s into the early 1900s. The maps I have created show the correlation between textile mills and waterways from the 1840s until about 1880; by this point, railroads were becoming more widespread and textile mills were ditching waterways and waterpower for railroads and steam power. To remain competitive in the textile industry, it was important that these mills upgraded their sources of power and transportation. By using maps, the transition through the various modes of power and transportation is very clear.

This map is the most extensive of all of the maps I created as it represents the entire Textile Heritage Trail.

I did not work on these maps alone. While what can be seen visually was created by myself, the data used to create them was a collaborative effort with fellow graduate research assistant Jarrett Craft. Without his help, the maps would not have been made. We worked together to gather mill coordinates, mill village boundaries, and mill histories. The two of us used both Sanborn Fire Insurance maps and textile directories to gather most of the information needed, with Google Maps being used to confirm coordinates and locations. 

This is an example of a Sanborn Fire Insurance Map from the town of Tallapoosa.

By creating these maps, the West Georgia Textile Heritage Trail is able to bring the textile industry together in a visual manner. For visitors, that means an easy way to see the geographic impact of the textile industry, as well as a way to navigate it.

My Textile Connections

Author: Greg Bell

Before I began working on the Textile Heritage Trail, I had never really considered how the textile industry had impacted my life. When I was first asked to write a blog post about my experience with textiles, I worried that I would not have much to contribute. After all, the era of the mill village is basically over, and the textile industry has changed drastically to meet the demands of the 21st century. Despite growing up in Cartersville, one of the communities on the Textile Heritage Trail, I felt very removed from the stories I have been researching. After giving the topic some thought, however, I realized that my life has been impacted by the textile industry much more than  I assumed. My hope with this blog post is to inspire readers to think about how they have also been affected by our shared textile heritage and to hopefully convince some to share their own stories with us. 

Sweetwater Creek State Park New Manchester Mill Ruins
Sweetwater Creek State Park New Manchester Mill Ruins. Photo courtesy: Kymberli Darling

The first connection I was able to make with the history of the textile industry comes from one of my biggest recreational pastimes- hiking. When I was in high school, I had the pleasure of hiking the trails at Sweetwater State Park for the first time. Since then, it has become one of my “go-to’ hikes whenever I get the chance and is also one of my top recommendations for people looking to hike near Atlanta. Despite the special place the park holds in my heart, I had never given much thought to the history of the area, or to the ruins that can be found during the hikes there. Now, through my research with the Textile Heritage Trail, I know so much more about the story behind this special place. 

Throughout the history of Georgia’s textile industry, mills and factories have been closed for numerous reasons. Some closed due to increased foreign competition, or due to loss of capital. In the case of the New Manchester mill in Lithia Springs, Georgia, the mill was destroyed along with many other manufacturing centers during Sherman’s March to the Sea at the end of the Civil War. One of Sherman’s goals on his way to Savannah was to remove any industry that would enable the Confederacy to continue outfitting their armies. This meant the mills and other manufacturers were often burned, shelled, or otherwise damaged in such a way that repair would be almost impossible. In Lithia Springs, the mill ruins were abandoned and left alone until they were incorporated into Sweetwater State Park. Today, visitors can hike around the ruins, and guided tours led by park rangers actually go inside the ruins. While the mill at Lithia Springs was a short-lived operation, its legacy continues to impact visitors more than 150 years after its destruction. 

Canton Mill Lofts Sign
Canton Mill Lofts. Photo courtesy: Cherokee County Historical Society

These recreational connections go much further than just hiking the ruins of an old mill. Many towns have converted their mills into apartments, shopping centers, or event venues. People throughout West Georgia live, work and play in these repurposed mills, and these places can be the setting for lifelong memories. Additionally, many mill village homes are still standing, and are privately owned residences now. The amenities from these mill villages such as parks, baseball fields, and stores may still exist, either in their original form or in a modified way, and be a part of our everyday lives. 

Aerial view of Goodyear and Mill Village
Goodyear and mill village aerial view. Photo courtesy: Bartow History Museum

This idea that the legacy of a mill carries on long after its doors are closed got me thinking about Cartersville, where I grew up. Cartersville’s textile history is similar to many towns in the region. The first mill in the town was established in 1904, and by the mid-20th century, the textile industry had grown to accommodate multiple facilities and employed large portions of the town. Cartersville families also participated in the chenille trade along U.S. Highway 41, also known as Bedspread Boulevard. By the early 2000s, most of these businesses had closed their doors. But rather than disappearing entirely, the textile industry of the past changed. Now, rather than producing horse collar pads or hosiery, Cartersville’s textile plants produce carpet for Shaw Industries, one of the largest carpet manufacturers in the world. This evolution from a local and regional textile center to a globally relevant one has been huge for Cartersville. Growing up, I had several friends whose parents worked at “the carpet place,” and now many of my friends work there themselves. This is a story that many towns in Northwest Georgia can identify with.

Often, when we think of the textile industry, our minds are filled with images of mill towns, company stores trading in scrip, and individuals working long hours on dangerous machinery. While these images aren’t incorrect, they show us only part of the picture. As we say on our homepage of the Textile Heritage Trail website, the textile industry touches us all. If you’re like me, your connections with the industry may seem faint or tenuous at first glance, but upon further inspection, you find that they actually run much, much deeper. Whether you live in a converted mill apartment, grew up in a mill town yourself, or just hike in the ruins of a mill long gone, you are connected to the textile story of west Georgia. These are your stories, and we would love to hear them.

My Journey Into Mapping

Author: Jessica Sinel

As an undergraduate research assistant, I was tasked to create maps to visualize the West Georgia Textile Heritage Trail during the Fall 2020 and Spring 2021 semesters for the Center of Public History. This project allowed me to gain further knowledge of working with Geographic Information Systems (GIS) and working with mapping programs such as ArcMap and ArcGIS Pro. This feature story will focus on my work in creating maps for the Textile Heritage Trail.

Before maps could be created, the raw data from the Davison Blue Book had to be organized for ArcMap to work correctly. With the help of Dr. Andy Walter from the Geoscience department, and Jamie Bynum, we organized the data by year from 1870-1976, and we listed each city’s (from Columbus to Dalton) number of mills, type of product produced, and nonlocal owners. We then focused our attention on the number of mills, so we made a dataset with every city on the Textile Trail, and the number of mills for each city from 1870-1976. Dr. Walter included latitude and longitude of each city so that the cities can be mapped with the location of each city. After the data was organized, we then familiarized ourselves with the new dataset by creating charts and graphs of the data to give us an idea of what the data looks like. After getting a feel for the data, it was time to start creating maps for the number of mills.

Dr. Walter showed me how to add the data into ArcMap, and I started working on mapping the number of mills from 1870-1976. I first started with how the map was going to look such as the layout, style, color, symbols, labels, font sizes, etc. The look and details of the map can be changed throughout the course of creating the maps, which I will talk more about later in this blog. I created a map for each year to show the number of mills for each city and the total number of mills in operation for that year. The maps displayed roads including freeways and highways, rivers, and railroads to illustrate how each city might have used the roads, rivers, or railroads to transport the products into the mills. I also created maps that showed different time periods, such as one map for the number of mills between 1870-1928, another between 1929-1957, and another between 1958-1976. After creating the number of mills maps and revising the look of them, I went to work on animating the number of mills in a map.

Animating a map was a new learning experience for me because I have not done one in any of my GIS classes. Animating a map allows the reader to see changes in the data as it moves through time in either seconds, days, months, years, or decades. It took me a week to learn how it works and how to create a time animation for the number of mills. The data does not have every year between 1870-1976, and because the years are irregular, animating the map is a little more difficult. ArcMap can animate a map, but its animation is basic and relies on data for every year with no gaps. Because the years in the data has gaps, ArcMap would not work for this project. I had to learn a whole new program, ArcGIS Pro, to be able to animate the number of mills. ArcGIS Pro can animate both regular and irregular time intervals, and can add titles, texts, and images to the animated map. I have not used ArcGIS Pro until this project, so this was also a new learning experience for me. After two weeks of familiarizing myself with ArcGIS Pro, I was able to create a time animation for the number of mills from 1870-1976. It took me several attempts to get the animation looking how I wanted it to look.

After the number of mills were mapped, I then focused my attention on the non-local owners. The data for the non-local owners contained the city and state that the owner was living in while owning a mill(s). The city’s location of the non-local owners then had to have coordinates in order for the owners’ location to be mapped, so I used Google Earth to help get coordinates for each city. The location of owners can now be mapped. I used ArcGIS Pro to create these maps. I created flow maps, which is lines from a starting location (like the regions used in these maps) to the owners’ locations. I separated the maps into four time periods and separated them into three regions (Northern, Central, and Southern). I created buffers with these maps to show how far away the owners were from the mill’s region. The buffers included 100, 500, and 1,000 miles from the center and included percentages of the owners located within each buffer. It is a good way to show how the non-local owners’ range widely and how most of the owners were in the northeast region of the U.S. Since these maps can be sometimes confusing, I created an interactive map of the owner’s location so that you can turn on and off years and regions so you can see the owners in your own way. The interactive map does start with no layers displayed so that you are not overwhelmed with the information to start with. The interactive map can be found here:

https://uwg.maps.arcgis.com/apps/instant/interactivelegend/index.html?appid=4294b64dff254ea3886f99b3a44686b6.

After the non-local owners were mapped, I then turned my attention to the product types that were produced in each town. The data for the product types included cotton, woolen, dryers & finishers, knit goods, rayon & silk, jute, synthetic, cordage, printing, and cord., twist & duck. I then mapped the product types using ArcGIS Pro, and I created pie charts to show the amount of each product type on the map. I started with mapping the product types in each region (the towns in each region were combined) over three time periods, 1870-1928, 1929-1957, and 1958-1976 and they also included the number of mills in each region. These maps also contain a table of the percentages of each product type which corresponds to the pie charts on the map. I then created maps of the product types in each town using the same three time periods. The results of these product type maps show that the early years mostly had cotton and slowly over time had a wider variety of different types of product. I was also able to create a time animation map for the product types produced in each town so you can see the changes of product types produced over time.

Getting the details in a map can be time consuming and can take days or even weeks to get the exact color, style, or layout just right. For a map to look professional, time must be taken to make it look professional. There can be several things that can make the difference between a professional looking map and a poorly looking map such as: is the map balanced, are the colors balanced with the rest of the map (is it too bright, or too dark), are the labels for each city in the correct location and not overlapping with other cities and symbols, are the symbols big enough to see, is the data accurate in the map, etc. There are many other things that can go into the details in a map. The maps need to have a professional layout so everyone can read and understand the maps, no matter how experienced they are with reading maps. This was important to me in creating maps for the Textile Trail because I want the maps to look as professional as possible so that everyone can read and understand the maps that I have created for the Textile Trail.

I learned so much from the West Georgia Textile Heritage Trail project these semesters. I not only learned to organized raw data, create new maps, and create a time animation map for the number of mills from 1870-1976, but I also learned the history of the textile industry in West Georgia. You can learn so much more working with a project compared to what you can learn in a classroom. I was able to take the knowledge that I learned in the classroom, expand upon it, and apply it to a real-world project. I also learned that visualizing data could have endless possibilities. I would like to thank Dr. Andy Walter, Dr. Ann McCleary, and Keri Adams for giving me this amazing opportunity to work with the West Georgia Textile Heritage Trail project.

Examining the Trail’s Sanborn Maps

Author: Tinaye Gibbons

1895 Sanborn Fire Insurance Map depicting the Kincaid Manufacturing Company and Griffin Manufacturing Company. These maps are important because they help us to understand which operations took place where and on what floor. They also help us to track the growth of a plant when other sources might be lacking. Photo Courtesy of the Library of Congress

Textile history is important to us at the Center for Public History because of the diverse ways that it impacted communities across West Georgia specifically. We analyze and study the communities along our trail because of the influence and impact that the textile industry brought to and had on the area and region. Many of the people in these communities worked in, for, or somehow with the textile industry throughout the twentieth century. We have researched this history in these communities by analyzing the mills which were there, as cities had everything from cotton mills to chenille bedspreads, but all of them supported a workforce and sustained local communities throughout Georgia. This spring, we had an undergraduate research assistant who assisted us in researching these communities in a new way. She used Sanborn Maps to study textile mills in these areas.

The Sanborn Map Company was founded in 1867 in Pelham, New York, by D.A. Sanborn. Originally, these maps were created as fire insurance maps, so that businesses or residences, could be correctly identified and properly cataloged by fire marshals if disaster struck. 12,000 cities across Mexico and North America were documented and mapped out annually. Sanborn maps are incredibly useful as research sources because the collection of maps shows the change in industry over time by examining building additions, new mill structures, and mill homes, and the use of buildings by titles and names from year to year.

Sanborn Fire Insurance Map depicting West Point Manufacturing Company in its early days. Photo Courtesy of the Library of Congress.

Center undergraduate assistant Tinaye Gibbons spent the spring semester of 2018 looking at each available Sanborn map of communities along the Trail. The Sanborn maps allowed Tinaye to analyze the change in the built environment of cities as textile mills grew and expanded throughout each community that we had maps for. Some of these communities – Dalton and Columbus especially – had sixty or seventy maps whereas less industrial places had fewer. The majority of her work was focused around Dalton and Columbus, Georgia, as they were heavily documented by Sanborn Maps due to the amount of textile industry each city had. Columbus’s economy was driven by textiles, and most of the mills were cotton-based. Muscogee Manufacturing Company, for example, employed 650 people in 1910 and manufactured denim, towels, and even couch covers.

Tinaye noted in her research that, “not every community on the Textile Heritage Trail had Sanborns created, but the majority of cities that were present did allow me to look at a wide range of textile industries.” Dalton, Georgia, similar to Columbus, also had an economy that was strengthened by the textile industry in the city. The diversity of textile mills throughout Dalton is evident in Sanborn maps, as the textile industry grew throughout the city.  The carpet manufacturing was the longest operating mills in Dalton. Chenille bedspreads, hosiery mills, and carpet production all fueled Dalton’s economy in addition to the cotton mills.

These maps documented local history as well, due to their ability of showing how the city was changed by the textile industry growth and decline. Sanborn maps helped to document change in the city as new mills opened, closed, and new businesses took over mill spaces as they closed down over time. The textile industry fueled the economy for many of these cities. As textile mills continued to thrive throughout the twentieth-century, cities adapted to the expansion of the mills that were there. As technology advanced, mills began to expand both in function and in size. Whereas mills used to just produce goods, now they were able to dye the fabrics in house, for example, and the Sanborn maps were great resources for documenting these changes as mill buildings showed up on different maps. The history of the city is evident in Sanborns as well as it shows how local businesses and city growth were impacted by the textile industry.

Tinaye Gibbons, Undergraduate Research Assistant on the West Georgia Textile Heritage Trail

Tinaye was hired through UWG’s Student Research Assistant Program (SRAP) through the Honors College. This position meant that she needed a project to focus her scholarship and a way to present her research. Tinaye chose to focus on the economic impact of Carrollton’s cotton and hosiery mills on the city using Sanborns. Tinaye decided to focus her project on the Carrollton textile history because she was not very familiar with Carrollton. She noted that, “I am not from the west Georgia region, so this project exposed me to different cities that I had never been to and I was able to look into different years of each cities’ [history].” Her project research focused on Mandeville Mills, rehabilitated as the Mandeville Lofts, and presented about it at Scholar’s Day held at UWG. In her presentation, she analyzed the change in the American Textile Narrative as she examined the growth of Mandeville Mills during the 1920s, 1930s, and the 1940s. Tinaye said, “I wanted to show the change that America went through each decade, and how a mill in Carrollton could reflect the changes in America during each time.” The Sanborn maps assisted heavily with this research because it showed how textile industries grew and eventually declined throughout the twentieth century.

Sanborn maps allow for history to become a physical element. A city’s growth in industry, in size, and in city shape can be seen in Sanborn maps as the buildings shifted, opened and closed each year. Tinaye found out through that Sanborn maps that, “many cities did not just have cotton mills, but additionally had bleachery companies, machine shops, hosiery mills, knitting mills, and apparel manufacturing plants along with textile mills.” This allowed for a lot of comparisons to be made as well. Take Columbus, Georgia, for example. Tinaye spent significantly more time familiarizing herself with Columbus’s industrial history than some other places because there was just more industry there. The Sanborn map collection boasted thirtyish years’ worth of change and documentation in Columbus since the textile industry was prevalent for so many decades in Columbus.

Tinaye contributed to the Textile Heritage Trail heavily due to her research with the Sanborn Maps. Her study of the maps helped our team to better understand industry in the cities and allowed us to visually process all of the information and research that we had about the textile industry in Georgia. By analyzing the Sanborn maps, Tinaye could measure change in the cities over time, both yearly or in larger gaps, like she did at her presentation. This research helps us to understand the textile industry better, because it answers the questions of why, when, and where a certain building was built and for what purpose. That information is crucial to telling the history of the textile industry in Georgia, so that we can connect the places to the people who lived there.

Mapping Out History

Author: Brandon Cohran

It has always been important to us at UWG’s Center for Public History to include and to highlight student work in our projects. In this blog post we feature maps of the Textile Heritage Trail created by students in Dr. Andy Walter’s advanced economic geography seminar during Spring 2017. These maps reveal spatial dimensions of, and provide geographical context for, the history we are seeking to bring to life through the Textile Trail project.

Dr. Walter began collaborating with the Center’s directors, Dr. Ann McCleary and Keri Adams, in 2016. For Dr. Walter, an economic geographer in the Department of Geosciences, the Textile Trail project was an opportunity to engage in mapping (did you know that geographers love maps?) while learning about an industry that has played a defining role in the West Georgia region’s economy and urban system. Ultimately, the goal of this partnership is an interactive mapping component to the Textile Trail, perhaps built into a mobile app, as well as series of maps representing the historical geographical evolution of the textile industry in the region. Dr. Walter is also working on the Center’s University History Project to create maps and a digital mapping platform to tell the stories of the people, programs, and spaces that make up our university. The heat map above was created by Dr. Walter to show the spatial density of mills across space, i.e. the number of mills in localities from place to place.

Continue reading

Interpreting Carrollton

Author: Brandon Cohran

History with a capital ‘h’ is often an early warning for people to become uninterested very quickly. It’s dates, places, the names of this or of that, and the worst part is, is that it never, ever, changes. Today, tomorrow, next week, and next year, History stays the same. Public history, however, is constantly in motion and is creating new opportunities for history to intersect with everyday life. The purpose of public history is to do exactly that – create an intersection between history and public spaces. In Carrollton, there are several institutions and resources available to anyone who wants to experience history beyond the textbooks. Public History students and faculty at the University of West Georgia have impacted this community for almost two decades. Before public projects ever happened, faculty and students of the Center for Public History conducted countless oral histories of and collected photographs and objects from people who lived in the area. 

Mandeville Mills, Carrollton, Georgia, ca. 1905. Courtesy UWG Center for Public History.

Carrollton, Georgia, is a city steeped in history. The city incorporated in the mid-nineteenth century, and after the railroad expanded close to Carrollton, the textile industry started in Carrollton with the opening of Mandeville Mills in 1899. Today, the extant structures of mill no.1 and its various additions were converted condominiums, and the mill is on the National Register of Historic Places. The former home of Clifton Mandeville, founder of the mill, still stands near downtown and displays the beauty of the Victorian-style home. Across the street, at Feathers & Twigs, there is an interpretive  sign outdoors, which details the former home, as well as other historic homes along Maple Street. This sign is one of five interpretative panels for the Textile Trail located in Carrollton, which are  supplemented by a self-guided walking trail brochure. This signs were curated and designed by three public history graduate students, Andy Carter, Keri Adams, and Jennifer Teeter, working with the Center for Public History.

Flyer highlighting the museum’s upcoming exhibit. April – June, 2018. Courtesy Southeastern Quilt and Textile Museum.

In addition to the old cotton mill, Carrollton is home to the Southeastern Quilt & Textile Museum. This museum allows visitors to experience textiles in a unique and exciting way as they have many textiles in their collection and feature exhibits with them. The interpretation done at the museum allows visitors to not only get a better understanding of the history on the textile industry, but also to see products that were created during the nineteenth and twentieth centuries in Georgia. The museum features quilts dating back as far as the 1790s, and many of them feature local and state artists. Typically, there about 30 quilts on display at any time, and visitors are welcome to interact with them – just wear gloves! Every semester, the Southeastern Quilt & Textile Museum hosts a graduate student from UWG. This spring, Museum Studies Certificate student Chloe McNeil serves as the museum’s Operations Manager and Curator in which she is tasked with daily administrative operations, curator of collections, and education programs. Public History graduate student Kymara Sneed works part-time in guest services.

Adamson Square, Carrollton, Georgia. Courtesy UWG Center for Public History.

Outdoor interpretation is abundant throughout Carrollton. There are 23 historic markers throughout Carroll County, and Carrollton boats six of them. These historic markers feature people or events pertinent to Carrollton’s history. Adamson Square, in downtown Carrollton, in the past few years has experienced a revitalization of the history behind the square. There has been an effort to keep a historic look and feel to the buildings around the square. One of the buildings, Horton’s Books & Gifts, is the oldest bookstore in the state. The downtown Carrollton Historic District and surrounding streets were placed on the National Register in 2007. 

In addition to the historic markers scattered throughout Carrollton, there are also several walking tours available, many of which involved work done by graduate students from the University of West Georgia. These trails vary from the historic district walk to the historic cemetery tour – which is currently being updated for Carrollton Main Street – by Melanie Sigman in collaboration with Geosciences faculty member Dr. Andy Walter. Brochures for these tours are available via mobile apps, or at the Carrollton Main Street office, or Log Cabin Visitor Center on Lake Carroll. The City Cemetery guide, which is offers a detailed commentary about the cemetery, the different sections of the cemetery, and it highlights some of the people who are buried there, such as the aforementioned Clifton Mandeville, and Newton Allen Horton – the namesake of Horton’s Bookstore. 

Newly installed interpretive plaque at LocoMex in Bowdon Station, Bowdon, Georgia. Photograph by Mignon Wessigner, Bowdon Area Historical Society.

To venture out of Carrollton just a bit, but to discuss another trail, my colleague Chanell Lowery, tomorrow, on March 13th at 5pm at Bowdon City Hall, is launching a Bowdon Spur Walking Trail Tour. As part of her thesis project, Chanell developed a walking tour in which visitors will learn about Bowdon’s textile heritage and how the community had a regional and national influence still seen today.  In her research, she discovered untold stories about the LaMar Manufacturing Company’s first African American employees, a pay stub from Warren Sewell Clothing Company, and the process of apparel manufacturing yesteryear. One of the most important narratives that Bowden’s apparel heritage is important because it shares common threads seen in history throughout the United States. Also, Bowden’s apparel companies have adapted to the textile hardships by changing their business focus to supplying tailored garments for the U.S. military.

An employee uses a hand iron to smooth and finish the lining of a men’s coat in this photograph, ca.1986. Courtesy Charles & Marjorie Middlebrooks, in memory and honor of the Plunkett Family.

Public history, to us at the University of West Georgia, is important because history through public engagement often facilitates lasting impressions on people about the place they live or visit. Why read about quilts from the local cemetery to see where people of the past are buried rather than driving by and glancing at the obelisks? It is our goal to promote the use of history to teach where, when and how events happened locally, statewide, and nationally. The city of Carrollton is actively bringing public history to its visitors in a variety of ways. As long as the community stays involved, and new ideas are embraced, public history will continue to encourage engagement with visitors and residents of the city.

A special thanks goes out to all of the previous students who have worked on this project along with my current team members Emily Harrington, Chanell Lowery, and Tinaye Gibbons. In addition, a thank you to the Center faculty Drs. Julia Brock and Ann McCleary, and Keri Adams.

Textile Talk

Author: Brandon Cohran

A new year ushers in new changes, and for us at the Center for Public History at the University of West Georgia, we are making changes as well. Beginning this month, we are looking to bring unique and diverse blog posts to the website in order to offer fun, new, and interesting perspectives about the West Georgia Textile Heritage Trail. As a new graduate research assistant, and the Textile Heritage Trail Curator, I am ecstatic about the Textile Trail project and all of the potential stories and experiences that will come out of this ongoing documentation of regional history.

What is the Textile Heritage Trail, you ask? Why does it matter? Well, the West Georgia Textile Heritage Trail, or Textile Trail, is a research project conducted by students and History Department faculty in the Center of Public History at the University of West Georgia. The Textile Trail is a heritage tourism initiative, whose shared history is curated and researched by students in order to tell the stories of communities throughout northwest Georgia. The Trail spans from Dalton to Columbus, Georgia, along the U.S.Highway 27 corridor, and focuses on this region from antebellum to the present day, while telling the history of the textile industry in the region. The textile industry built small Georgia towns and cities during this period.

Photo of the 1904 Chattooga County Fair in Summerville
Product showcase at the Goodyear Tire Plant in Cedartown, Georgia, 1950s. Courtesy of Polk County Historical Society.

Textiles, such as, cotton mills and hosiery mills, as well as chenille, carpet, apparel and garments, led to the manufacturing of rubber wire and tire cord for automobiles. The textile industry throughout central and northwest Georgia, created economic growth and stability, which led to a strengthened infrastructure for small towns along railroads and rivers.

Foundations of the Textile Trail began long before its founding in 2012. It started with the work of History students and  faculty that conducted research and oral history projects in proximity to the University of West Georgia in the early 2000s. The first wave of research was an indication of the importance that textiles, primarily cotton, had on the growth of various communities in size and in the economic stability in the Carrollton area. In the spring of 2012, the Textile Heritage Trail became a Center-based project that utilized student work every semester. The years of research and labor became a centralized focus of the Center, and through all of the past and present work, each year new discoveries help us to update our information about the communities along the Trail in addition to creating new entries.

The next milestone for the Textile Heritage Trail came in 2013 in thanks to a grant that the Center received from the Callaway Foundation of LaGrange, Georgia. History student researchers and faculty embarked on new research and image collecting leading to the Trail’s first guidebook, The West Georgia Textile Heritage Trail published as a part of Arcadia Publishing’s Images of America series in December 2015. The Center, through the book project, was able to develop deeper stories and to form stronger community connections to the textile industry. We use our website, self-guided walking tour brochures, and interpretive signs to tell these stories.

Our current student-staff working on the Textile Heritage Trail consists of three graduate research assistants, one of which has worked the project since the fall of 2014. Together it is our mission, I feel, to provide enriching stories, educational information, and to give exposure to the diverse range of people whose lives changed because of the Textile Trail throughout north and west Georgia. My two project team members are Chanell Lowery and Emily Harrington. They both contribute heavily to the success of the project along with myself, Brandon Cohran.

Emily Harrington, our Strategic Planning Coordinator for the West Georgia Textile Heritage Trail Project, is in her second consecutive semester being involved on the Textile Trail as a Graduate Research Assistant. This new planning initiative is generously funded by the Callaway Foundation of LaGrange, Georgia.  Emily said that she “has enjoyed [her] time working on the Trail. It has had its challenges along the way but those challenges have been great learning opportunities for me.” She acknowledges that, “the future is sure to bring some great changes for us due to sticking with our strategic plan to incorporate future improvements to the Textile Trail.”

My other peer, Chanell Lowery, has been involved with the Trail project for over three years now, and with that, she has fulfilled many roles. Currently, however, she is working the completion of the Bowdon Spur Project (and leading the tour for it), while also transitioning digital databases, completing membership signs, and finishing newsletters and community brochures. Her experience with so many aspects to the Trail helps to keep the project organized and intact. The project touched home with Chanell, as she said, “when I started working on the Trail three years ago, I thought my work would be about helping others learn about their heritage, but it turns out I ended up learning about mine too. Last year, I learned that my  great-great-grandmother, Dora Lively, worked at Callaway mills.”

In addition to the dedicated work that both my colleagues Emily and Chanell do for the project, I am the new Curator for the West Georgia Textile Heritage Trail. So far, my contribution to the project has included the development of this blog, but also community research for the entries on the website and compiling new community histories to explore. I hope that these entries will not only be informational about the Textile Trail Industry in the area, but that the region’s past will connect to the present. My goal is to have the website community pages, and the blogs, be informational and unique. In my limited exposure to the Trail, so far, I have seen how important the textile industry was to the development and stability of small communities all throughout Georgia.

Two Chenille Spreads depicting peacocks outside of Prater's Mill
Chenille bedspreads on display at Prater’s Store, Dalton, Georgia. These two bedspreads feature colorful peacocks,  an iconic theme of the Old Dixie Highway chenille shacks in the mid-20th century. Courtesy of Janet Cochran.

To compliment the information on the Textile Heritage Trail website about the community’s textile history, we also include places to visit and activities to do when in the surrounding area. This added dynamic helps highlight the lasting impact that the Textile Trail had on the communities and people in the decades following the decline of the industry. Many, but not all, of the sites listed as places to visit display textiles or give their community’s narration of the impact that the textile industry left on the people who lived there.

The Textile Heritage Trail focuses on the people who lived in communities along the Trail and how their lives changed due to the textile industry throughout Georgia. I find it exciting that we, the current student-staff of the Center for Public History, continue to discover and tell the amazing stories of these people. Moving forward with this blog, I hope to focus on one key element or group of people every month, so that we, at the Center for Public History, can continue to grow and expand on the variety of ways that the Textile Heritage Trail influenced the people of Georgia.

A special thanks goes out to all of the previous students who have worked on this project along with my current team members Emily Harrington and Chanell Lowery. In addition, a thank you to the Center faculty Drs. Julia Brock and Ann McCleary, and Keri Adams.  

css.php