Warning: Undefined array key "file" in /home/westgate/public_html/wp-includes/media.php on line 1749
Author: Jamie Bynum
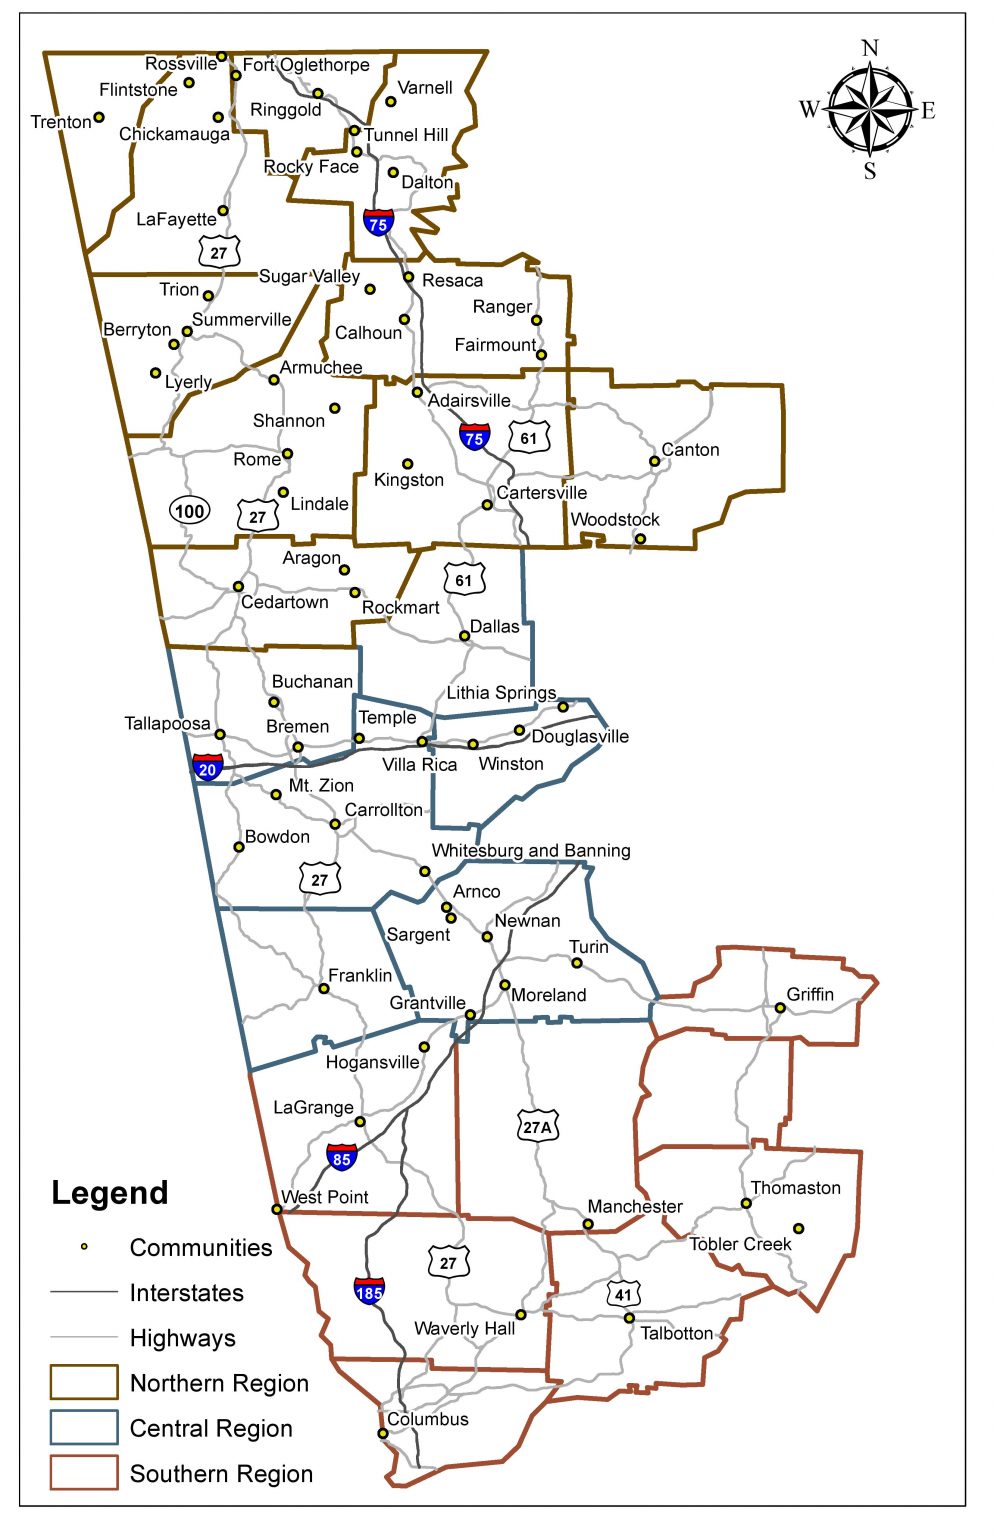
I began working for the Center for Public History at the University of West Georgia in January 2020. I have worked exclusively on the West Georgia Textile Heritage Trail project performing a variety of tasks. My main task has been to create maps for the Trail to bring history to the public in a visual manner. To accomplish this, I have used two programs: Story Maps and ArcGIS. These maps also serve as my thesis project for my Master of Arts in History degree.

If you have looked through our community pages, you might notice almost all of them have an interactive map showing textile-related locations within that respective community; these were all created using Story Maps. As the name suggests, Story Maps allow us to tell a story. For this project, that would be each community’s textile history. While the West Georgia Textile Heritage Trail is a digital history project, it is also a tourism initiative. The use of Story Maps allows the public to not only learn historical information about a community’s textile industry but navigate to these places to see what they look like today.
The maps I have created with the ArcGIS program are more for historical research rather than tourism. These maps, unlike the Story Maps, are not interactive and remain stationary. My thesis topic centers around the importance of waterways and railroads to textile mills in the 1800s into the early 1900s. The maps I have created show the correlation between textile mills and waterways from the 1840s until about 1880; by this point, railroads were becoming more widespread and textile mills were ditching waterways and waterpower for railroads and steam power. To remain competitive in the textile industry, it was important that these mills upgraded their sources of power and transportation. By using maps, the transition through the various modes of power and transportation is very clear.

I did not work on these maps alone. While what can be seen visually was created by myself, the data used to create them was a collaborative effort with fellow graduate research assistant Jarrett Craft. Without his help, the maps would not have been made. We worked together to gather mill coordinates, mill village boundaries, and mill histories. The two of us used both Sanborn Fire Insurance maps and textile directories to gather most of the information needed, with Google Maps being used to confirm coordinates and locations.

By creating these maps, the West Georgia Textile Heritage Trail is able to bring the textile industry together in a visual manner. For visitors, that means an easy way to see the geographic impact of the textile industry, as well as a way to navigate it.
Leave a Reply